The new flat color themes and colors provided in Centric 8 version 6.0 improves chart usability and enables better chart analysis.
![]() How to view Charts
How to view Charts
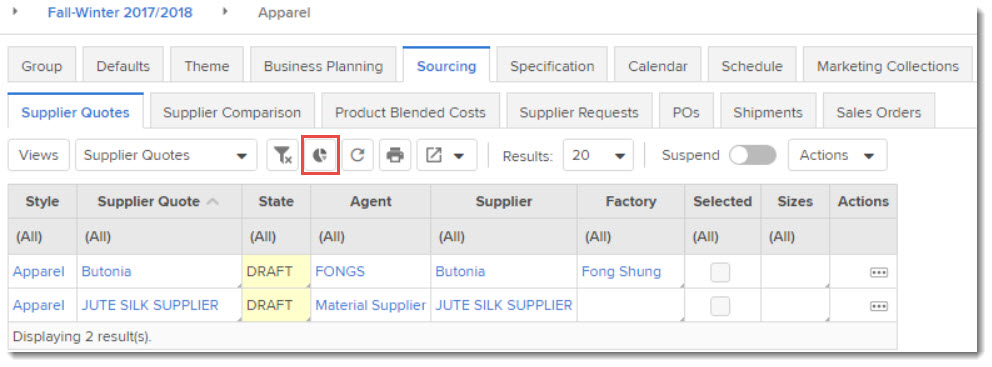
In the table toolbar, click on the Chart icon.
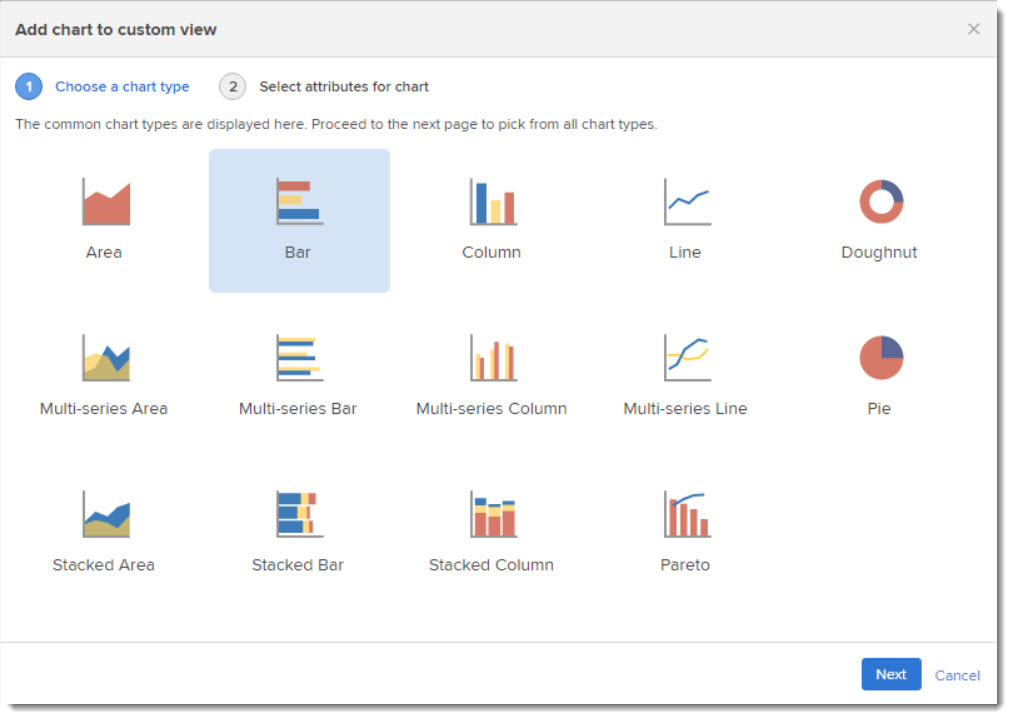
In the Add Chart to custom view dialog box, select the required chart type and click on Next.
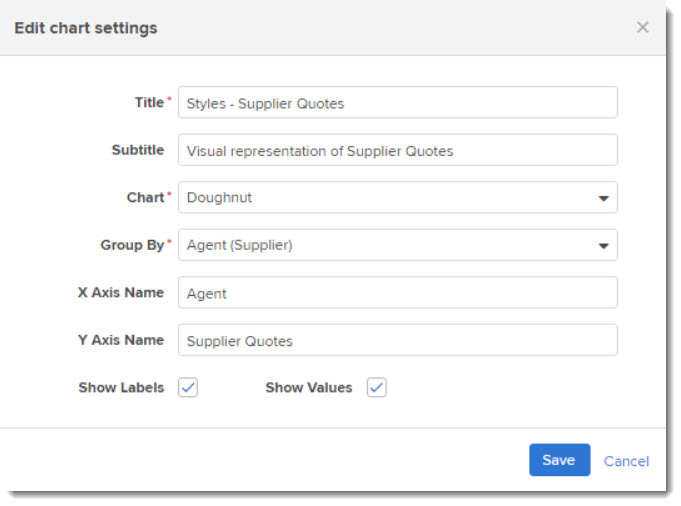
In the Edit chart settings dialog box, enter/select the required details and click on the Save button.
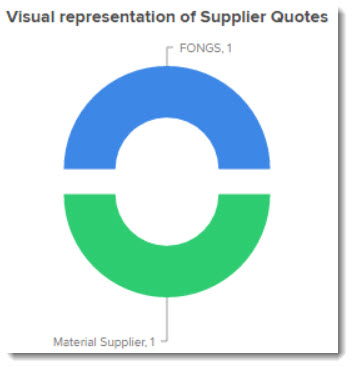
The chart is populated and displayed as shown below.